Is My Product Working?
For most startups and small businesses, analyzing your sales, your target audience, and your growth are extremely important in the early days. However, this won't be worth the investment if you realize that your product doesn't actually help or work. If your startup isn't providing consumers with worth then it's not going to be able to grow.
So, what is the most fundamental question that a product owner or manager would want to get answered with the help of data? After a decade of wrestling with product analytics, first as an engineer, then as a product manager, and later as a founder, I've come to realize the question is "Is my product working?" or maybe some variant of that.
We all want to know if our product is doing what it's supposed to do or if users can do the job that we're assuming they are here to get done with our product. If someone can give you an answer to this question, I've figured that you'll be at peace with the function of product analytics.

The answer to the ultimate question in the mind of every product owner or manager lies in Product Analytics, but it takes a little more than just data on a sheet to start unraveling answers.
But it's not that simple, is it? The first step is to understand how to interpret the question, "Is my product working?", and then to decide how it would translate into the schema of your product.
But that's when a lot of other questions start popping in your head:
"What are the key steps in a user journey that can give me an idea if the product is working?",
"How exhaustive should I be when logging user actions (or let's call them events)?",
"What type of analysis would help me process this data and get a picture of the product's effectiveness?" and many more.
Adding to this mayhem in your head is the pressure to learn from the best in product/growth and applying what they preach - be it cohort analysis advocated by Andrew Chen or the AHA moment propagated by Sean Ellis or the many more frameworks you will find around.
If you've been one of those unfortunate souls who have been racking your brain to find out your magic growth recipe, like Facebook's "7 friends in 10 days", or Slack's "2000 messages sent by a team", I can feel that pain. I've been through that.
The fact is a lot of these models and frameworks make sense when your product's adoption seems to be growing at break-neck speed, like what happened to Facebook, Slack, and Uber. If you are fortunate to witness growth at that pace, these frameworks help you give some meaning to the chaos that takes place.
But 99% of startups are not those rocket ships that have found an almost unreal product-market fit. So let's talk about this 99%, during the early stages of their journey.
To get started, let's try to understand what set of user actions or events make you excited in the early days of a product and how to understand them better.
Analytics in the Early Days
When you have just launched a product, it's usually the website visits that count. Gradually our eyes gleam at the occurrence of signups or user registrations. And we prepare ourselves for the most coveted event to happen, user payments when a user buys a subscription to your product. We keep obsessing about these numbers and try to invariably grow them 5%, 10%, 15%, or X% every month.
Of course, we will also want to keep a tab on the user churn event, that indicates how many users are canceling their subscriptions and leaving your product. While you want to increase all of the former ones, you learn that you want to be able to reduce the occurrence of the churn event. With these sets of numbers, we feel we are able to gauge our startup's progress and the sheer simplicity of this type of "core metrics model" appears appealing to everyone.

A closer look at your user journey, not just the lagging events but also intermediate ones that lead to them, is key in building a more optimized & delightful user journey.
The challenge with this approach is that they are all that we like to term as Lagging Metrics, which occur as a result of an experience journey the user goes through. They are the outcomes, good or bad as they may be. If you have a low user registration number for a month, you can't do anything to improve that for that month now (unless you can time-travel). You can only react to it.
When you think more deeply about it, you will realize that it's the probability of having a delightful user journey that you want to influence, to impact the Lagging Metrics. But then, how do we solve the problem of evaluating the user journey better? One easy solution could be to try an integration with MuleSoft, or any other integration service, and leave most of the personalization of the user experience on experts that can handle it. However, if we want to do it ourselves, we could map the user journey to a set of events, not just the lagging events but also intermediate ones that lead to them (naturally called Leading Metrics).
Typito as a case for Leading and Lagging Metrics
I reckon these concepts would be easier to understand with an example so let's pick the product we've been working on. In Typito's case, the key Lagging Metrics would be:
- User signs up (as a result of checking out the landing page and deciding to spend some time in the product)
- User subscribes to a plan (as a result of finding value in the product and deciding to pay for it)
- User unsubscribes from a plan (as a result of not being able to appreciate the value the product is adding to their workflow mostly)
While these indicate how we are doing, these data points rarely help us make product decisions. That happens, thanks to the Leading Metrics and they could be many.
For example in-between ‘user signs up' and ‘user subscribes to a plan' events, here are 5 candidate leading events that will help us understand how the user is doing:
- user creates a new video project (beginning of an intent)
- user uploads media in the project (beginning of a commitment from the user)
- user adds text and other graphics in the project (considering how Typito is known in the market for its superior motion graphics and text on video experience, this event could be critical for the user to appreciate the value offered by Typito)
- user exports the video project (indication of more commitment from the user)
- user publishes the video project (either downloads the video or publishes it on social media)
There could be more intermediate events but tracking more events could make it difficult for us.
The idea here is to identify the set of events that you think could be leading to an outcome that you care about and want to influence the probability of these leading events.
Now we need a nice way to visualize how these numbers are doing for your business.
What you need is a Funnel. No more, No less.
After trying quite a few different tools and frameworks for visualizing a product's metrics in the early stage, I've come to conclude that funnel serves the purpose the best. It gives you an idea of what's happening in the product from a journey perspective.
For example, here are two Lagging Metrics we measure at Typito - ‘user signed up' and ‘subscription started' with a Leading Metric ‘export completed' sandwiched in between.
Here are our numbers from January to March 2019.
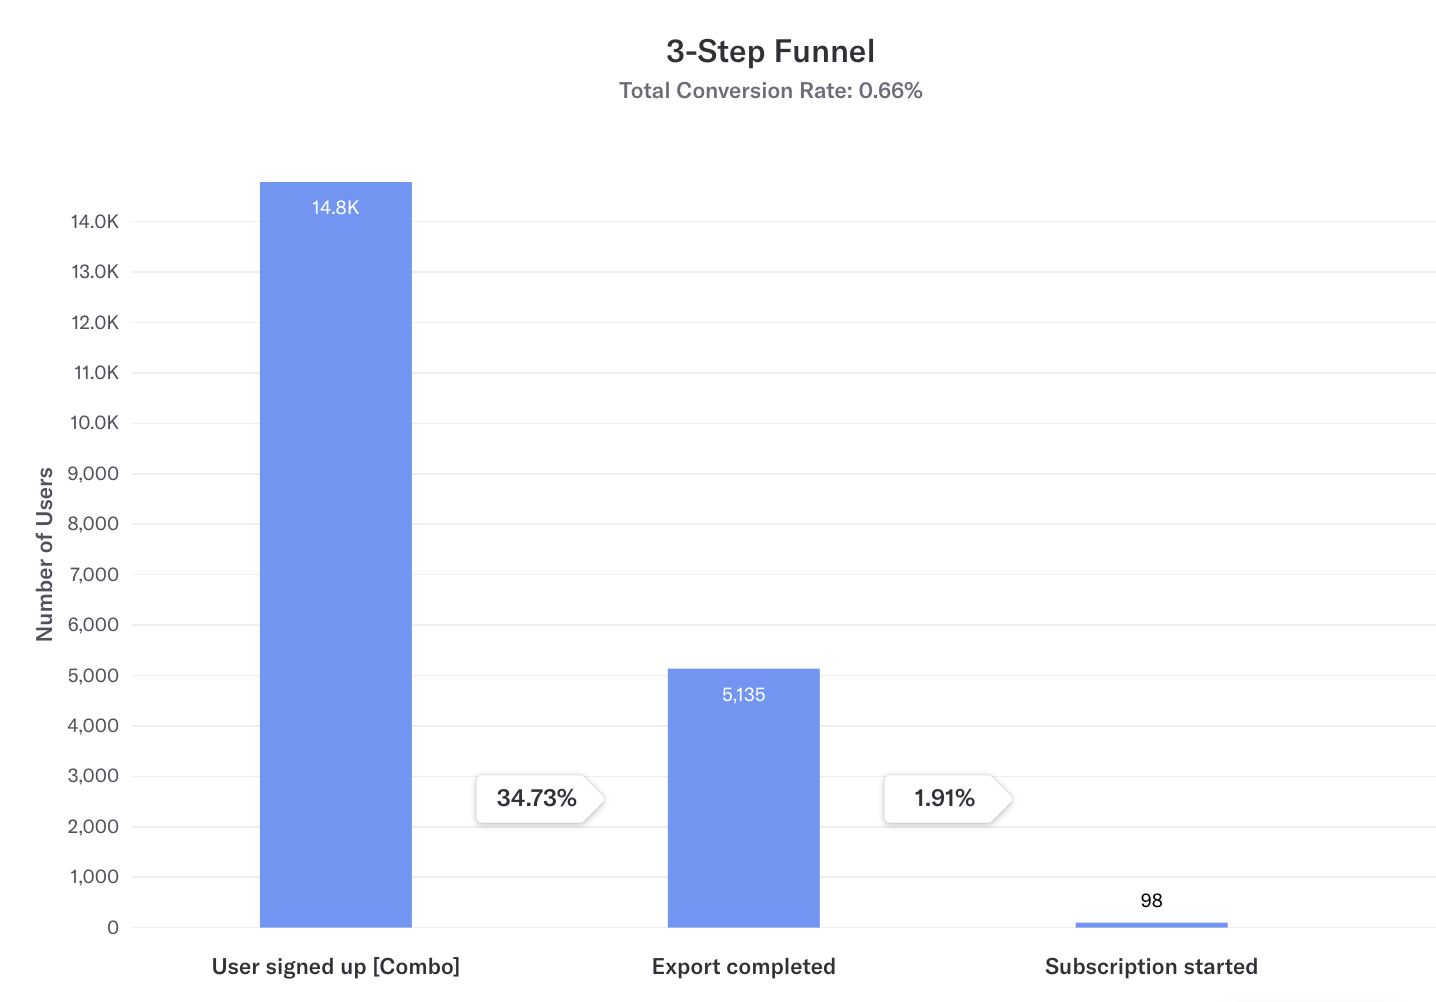
A Heap funnel on Typito from Q1 2019. A user signed up → Export completed → Subscription started.
We've defined ‘export completed' as a leading metric since we've validated that users who have exported their first video are most likely to subscribe as compared to users who have not exported their first video. This means our product team now knows that it's important to create the first user experience to help the user export their first video successfully and we can channel effort towards that.
This approach of building a better product deploys the popularly known method called Conversion Rate Optimisation (CRO). You now try to optimize the conversion rate from one step to the next, with the assumption that this funnel when optimized will lead to a better-desired outcome (more registrations, more paying subscribers, etc).
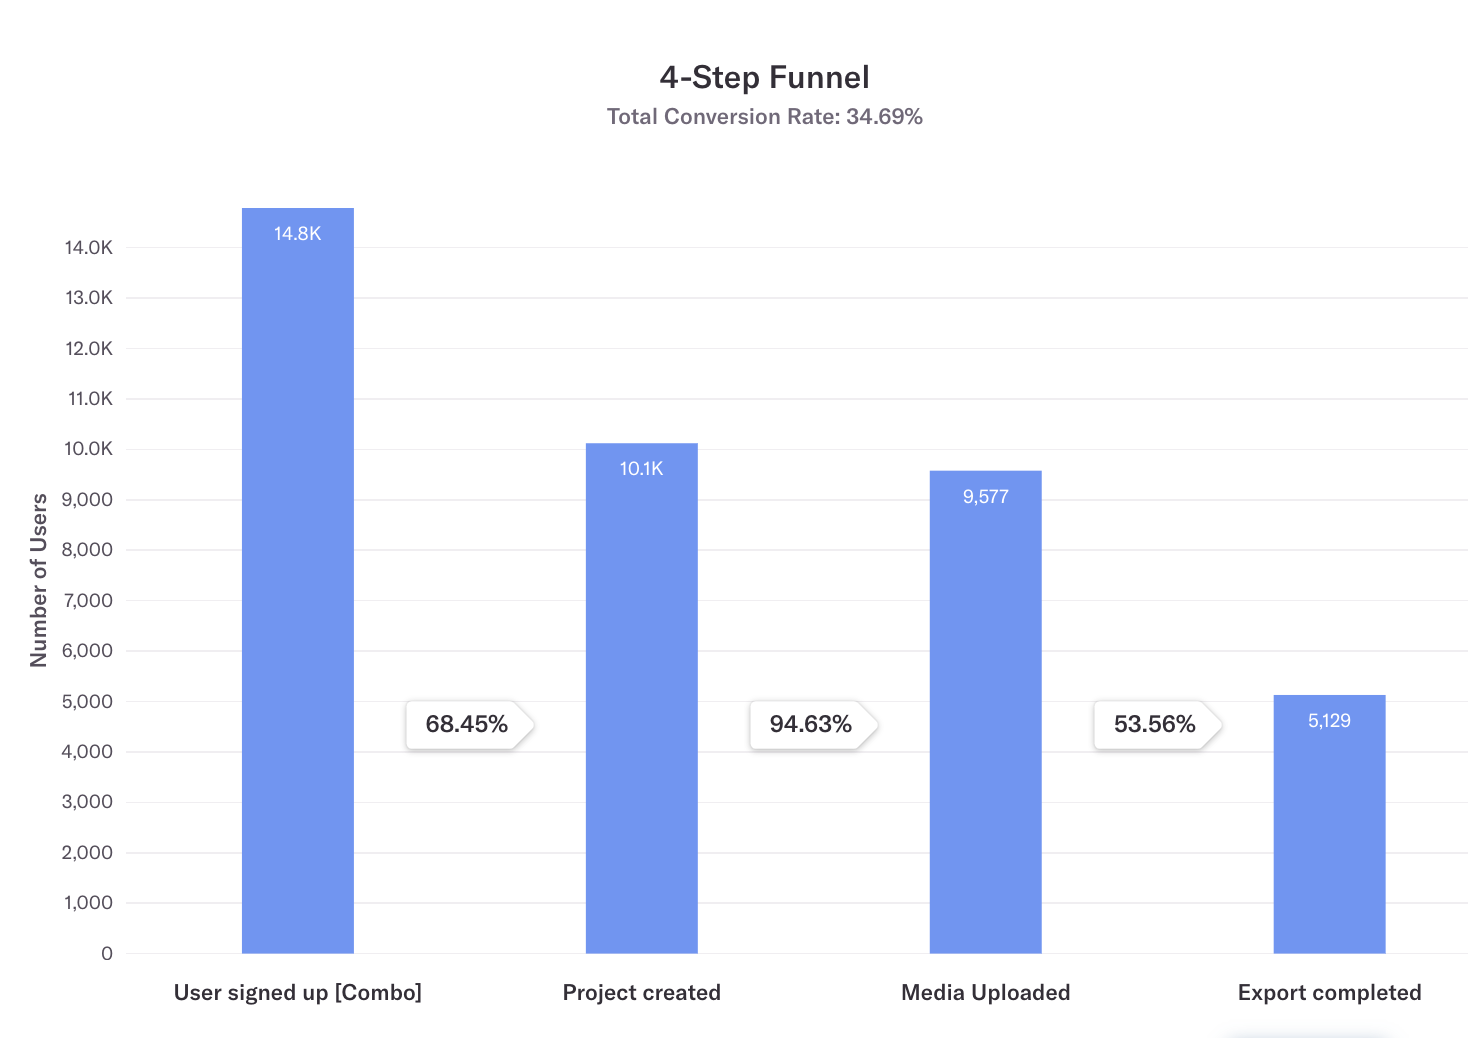
If you have a more complex product, you can also look at adding more Leading Metric points in between. For example, I could argue that the user should ideally do two more things before exporting a video - (1) create a video project and (2) upload media to the project.
This could help me focus on a zoom-ed in funnel:
More funnels :). Now I hope you're getting a hang of this.
Once you get comfortable with understanding funnels, the next question would be: "how can you use funnels to improve the product?"
Let's take the above funnel as an example. If you're thinking what I'm thinking, we know that ‘project created' to ‘media uploaded' seems to be doing all right with 95% conversion whereas the two tail-ends can do better.
This would mean that you could confidently work on product or user experience experiments that are designed to nudge more newly signed up users to create a project (thereby improving 68% to maybe 80%) and help more users who have uploaded media to export their edited video (improving 53% to 70%). This would invariably help you improve the ‘export completed' rate and going by our first assumption, give a higher ‘subscriptions'' count as well.
Funnels for Product-Led Growth
Product-Led Growth has taken the software world by a gale storm off late. While the trend to sell software in a way that minimizes human touch-points has been on a rise in the last decade, the motion got accelerated in 2020 with Covid-19.
The pandemic forced thousands of software companies to re-imagine how they acquire customers. It led to a do-or-die situation for many companies that followed a sales-led customer acquisition strategy - they had to transform their products into "ones that sell themselves".
It's easier to understand Product-Led Growth in the form of a better-known terminology in the user acquisition space: Leads. There are quite a few of the Lead types that you might be familiar with:
- Sales Qualified Lead (SQL): a lead that is qualified for a sales process or pipeline.
- Marketing Qualified Lead (MQL): a lead that was acquired by a marketing channel (a subscriber to your product or your blog)
With Product-Led Growth, we will add one more type of lead:
- Product Qualified Lead (PQL): a lead who is qualified for further selling by virtue of the progress they've made in the product. Typically these users have gone through product education by themselves.
I'd like to argue that a PQL for a startup or product is what is touted as the growth formula by different practitioners. For example, let's consider the "2000 messages in a workspace" magic number of Slack. A workspace that has over 2000 messages on Slack is likely to have undergone product education and realized the value of the communication platform. It's essentially a PQL. And getting more PQLs becomes very important for a product that has a self-serve nature to it, that is, you don't need a person to help you get onboard onto it.
Now how do we marry the two learnings: the Funnel and PQL?
The way we interpret Product-Led Growth in Typito is first to improve conversion rate in the funnel up to [PQL]. A user categorized as PQL in a self-served product is highly likely to have spent more time using the product. There are higher chances that they've gone through the learning curve and have figured out if the product is valuable to them or not.
If you can conduct experiments that help you improve the conversion rate of a user signing up to becoming a PQL with a self-serve product experience without human touchpoints, you are pursuing Product-Led Growth as a lever to acquire more active users.
As a lean bootstrapped startup, Typito had embraced many characteristics of Product-Led Growth without knowing what it is, from day 0. We focused on self-serve as a way to design product and marketing campaigns.
How to define your PQL
Well, at this point I have to conclude that this is a delicate mix of art and science. It's possible quantitatively to arrive at the state of a user's journey that's furthest away from the final goal (paying for your product) but has the highest causation effect on the final goal. However, I haven't found an easy way to decipher it mathematically for our product.

At Typito, we interpret Product-Led Growth as improving conversion rate in the funnel up to PQL.
A good way is to talk to your customers and try to understand at what of their experience on the product did they feel the first spike of value (the "AHA" moment). If you can deduce this point from customer conversations, that's great. If you are not there yet but want to give this a try, you might find some help in this book about how to talk to customers.
Of course, the laziest easiest way is for you to decide on your PQL definition by trying to visualize yourself at a point in the user journey where you feel the customer is likely to have decided, "Well, this is a good fit for me".
There's no harm in starting with your PQL definition this way. In fact, I would encourage you to do this in the very early days till you have a few customers you can speak to - it would only help you become better at visualizing user workflows in your product.
Tooling for Funnel Analysis
We talked about leading and lagging metrics, conversion rates, funnels, product-led growth, and product-qualified leads. Now let's try to understand how to put all of this together and that's where you will need tooling.
Yes, you will be able to track your metrics using SQL queries and spreadsheets. But that can get so painful that I'm afraid you might give up on following up with product analytics. This is where tools for product analytics come in handy. There are a few tools you will find in the market that will help you get started, like Heap, PostHog, and others.
During our early days at Typito, we were fortunate to use Heap and found it valuable for funnel tracking because of the following reasons:
- It's dead simple to use. The product interface is very intuitive.
- Heap's funnel module is very mature and powerful. For example, it helps you do interesting analysis with user segments that belong to each phase in a funnel.
- Heap provides you with a retroactive data logging feature. That is if you've identified a front-end event that qualifies as a Leading Metric in your analysis today but would like to find how that event has been doing since day 1 - no worries. Heap has got you covered since they track all front-end events exhaustively from the day their snippet is added in the code - you now just need to give that event a name :). I've covered more about this in this blog post.
I hope this blog post was useful and easy to understand. As a first-time entrepreneur, I struggled a lot with product analytics in the early days of Typito and I can understand if you are also going through the same difficult period. But I can assure you that knowing your product analytics can be a great enabler for you to conduct product and growth experiments and the earlier you get used to understanding funnels, the better it is. For that's a great starting point :).
~Matthew CEO, Typito