Jump to a section:
- What Are Video Engagement Metrics?
- What Is the Difference Between Reach Metrics and Engagement Metrics?
- Why Most Teams Track the Wrong Video Metrics
- The Video Engagement Metrics That Actually Matter
- How Engagement Metrics Change for Quiz & Interactive Videos
- How to Track Video Engagement Metrics Across Platforms
- How to Use Engagement Metrics to Improve Future Videos
- If I Only Track 3 Things This Week, What Should They Be?
- FAQs About Video Engagement Metrics
You publish a video, check the numbers, and see thousands of views. The dashboard looks healthy, but when someone asks a simple question, “Is this actually working?” The answer is not always clear.
As a creator, views alone don’t tell you whether people actually watched, understood, or engaged with your content.
That’s the reality for most video creators in 2026.
Most video platforms surface plenty of data, from views and likes to watch time and reach. But not all of these signals represent real engagement.
In many cases, high numbers can hide low attention, while smaller videos can quietly perform better with the right audience.
The problem isn’t a lack of data. It’s knowing which video engagement metrics actually matter, and which ones are shaped more by platform mechanics than audience intent.
As video strategies evolve, especially with the rise of interactive and quiz-based formats, traditional video analytics often fall short.
In this guide, we will break down what video engagement metrics actually mean, why many teams track the wrong signals, and how to interpret engagement rate video data in a way that aligns with real marketing goals.
What Are Video Engagement Metrics?
Video engagement metrics are the data points used to measure how viewers interact with a video, not just whether they saw it.
Unlike basic view counts, these metrics help marketers understand attention, interest, and participation. They show what people actually did while watching a video, such as watching longer, clicking, responding, or taking action.
In video analytics, engagement metrics are used to answer questions like:
- Did viewers stay and watch, or scroll away quickly?
- Did they interact with the content in any way?
- Did the video hold attention from start to finish?
What is the difference between Reach Metrics and Engagement Metrics?
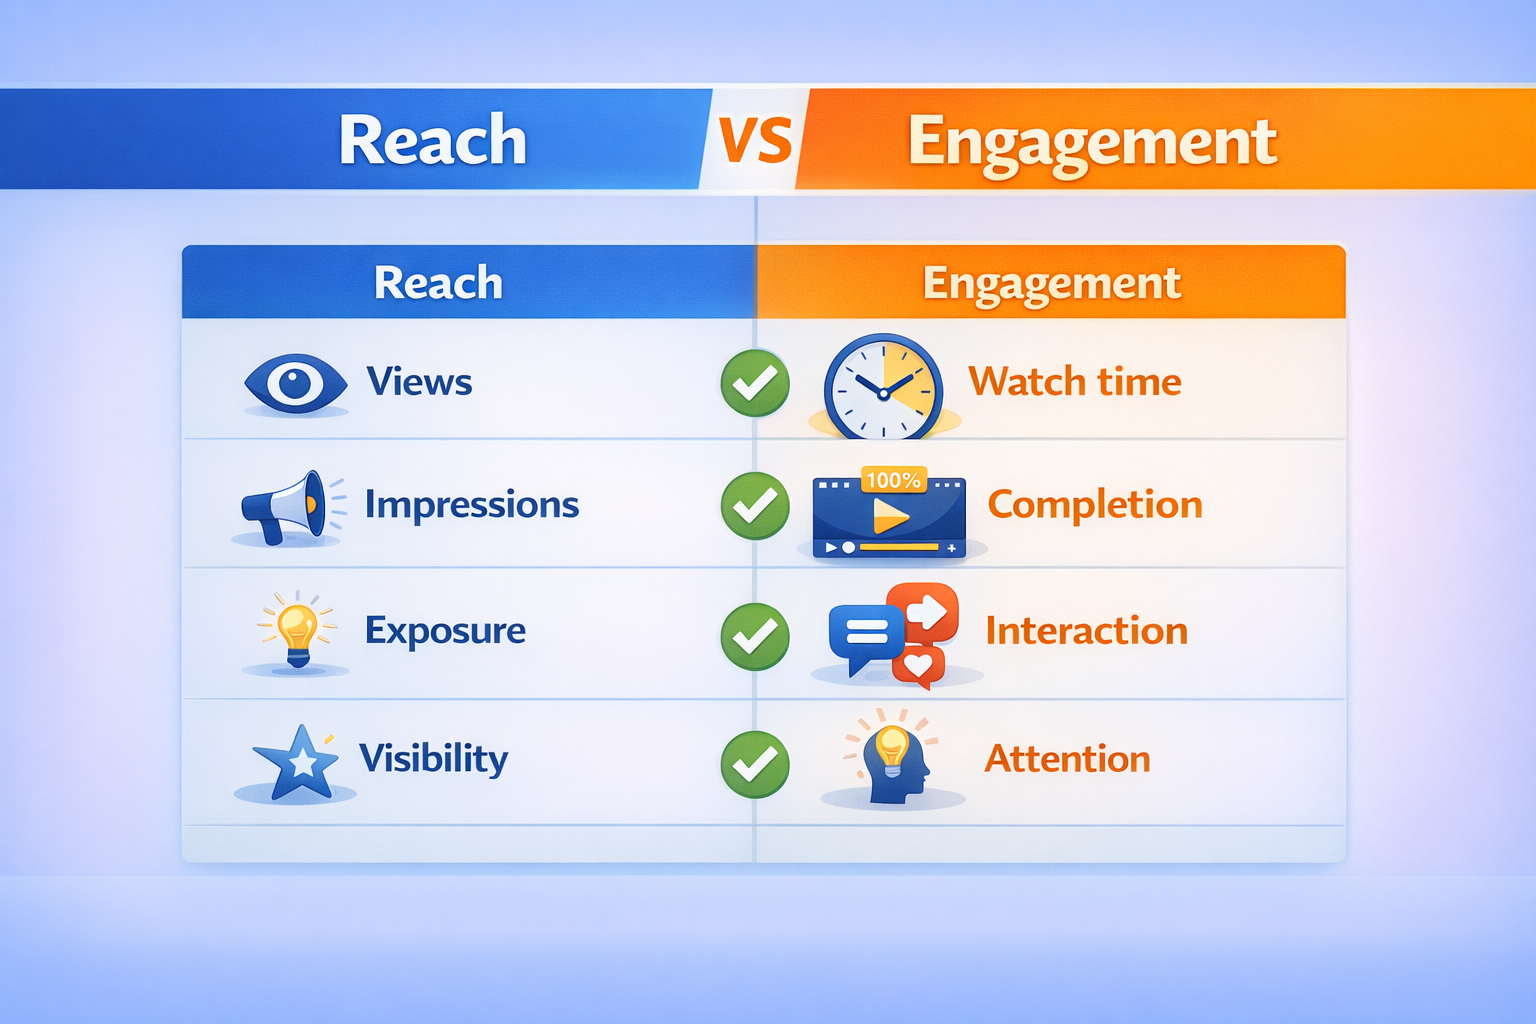
Reach Metrics
Reach metrics show how many people your video was exposed to. They indicate visibility, not attention. A view is often counted when a video appears on someone’s screen, even if the viewer scrolls past within a few seconds.
Engagement Metrics:
Engagement metrics measure how viewers interact with the video after seeing it. They show whether viewers stayed, watched longer, clicked, responded, or participated in some way.
Why Most Teams Track the Wrong Video Metrics
Despite spending a lot of time and money on video content, many teams are still unsure of the effectiveness of their productions. This frequently occurs because the incorrect metrics are being prioritised rather than because the data is missing.
1. Vanity metrics create false confidence
Views and likes are the most commonly tracked video metrics, but they are also the most misleading. A video can receive thousands of views even if most viewers scroll away within the first few seconds. In such cases, the numbers look strong, but actual engagement remains low
For example: You post a video and see 20,000 views within a few hours. It feels like a win. But when you open the analytics, most people watched only the first 2 seconds before scrolling.
This is how views can look impressive while real engagement stays low.
2. Platform bias affects video analytics
Different platforms measure engagement differently. When teams rely only on platform-provided metrics, they risk comparing numbers that are not measured under the same conditions, leading to inaccurate conclusions about video performance.
For example: You upload the same video on two platforms On one platform, it shows 15,000 views. On another, it barely crosses 5,000.
At first, it feels like the second platform failed. But later you realize one platform counts a view almost instantly, while the other requires viewers to watch longer.
Only the way the platform measures views did.
That is how platform bias affects video analytics.
3. Misaligned KPIs blur performance insights
Many teams track the same metrics for every video, regardless of its goal. A brand awareness video, a product demo, and an interactive quiz video are often evaluated using identical benchmarks.
When KPIs are not aligned with intent, engagement data becomes harder to interpret, and performance reviews become unclear.
For example: You create a quiz-style video meant to make people interact.
Some viewers tap answers.
Others replay the video to check responses. But when results are reviewed, only views and likes are considered. Since the view count is lower than usual, the video is marked as unsuccessful, even though people actually spent more time engaging with it.
The issue is not the video. The issue is measuring it with the wrong KPIs.
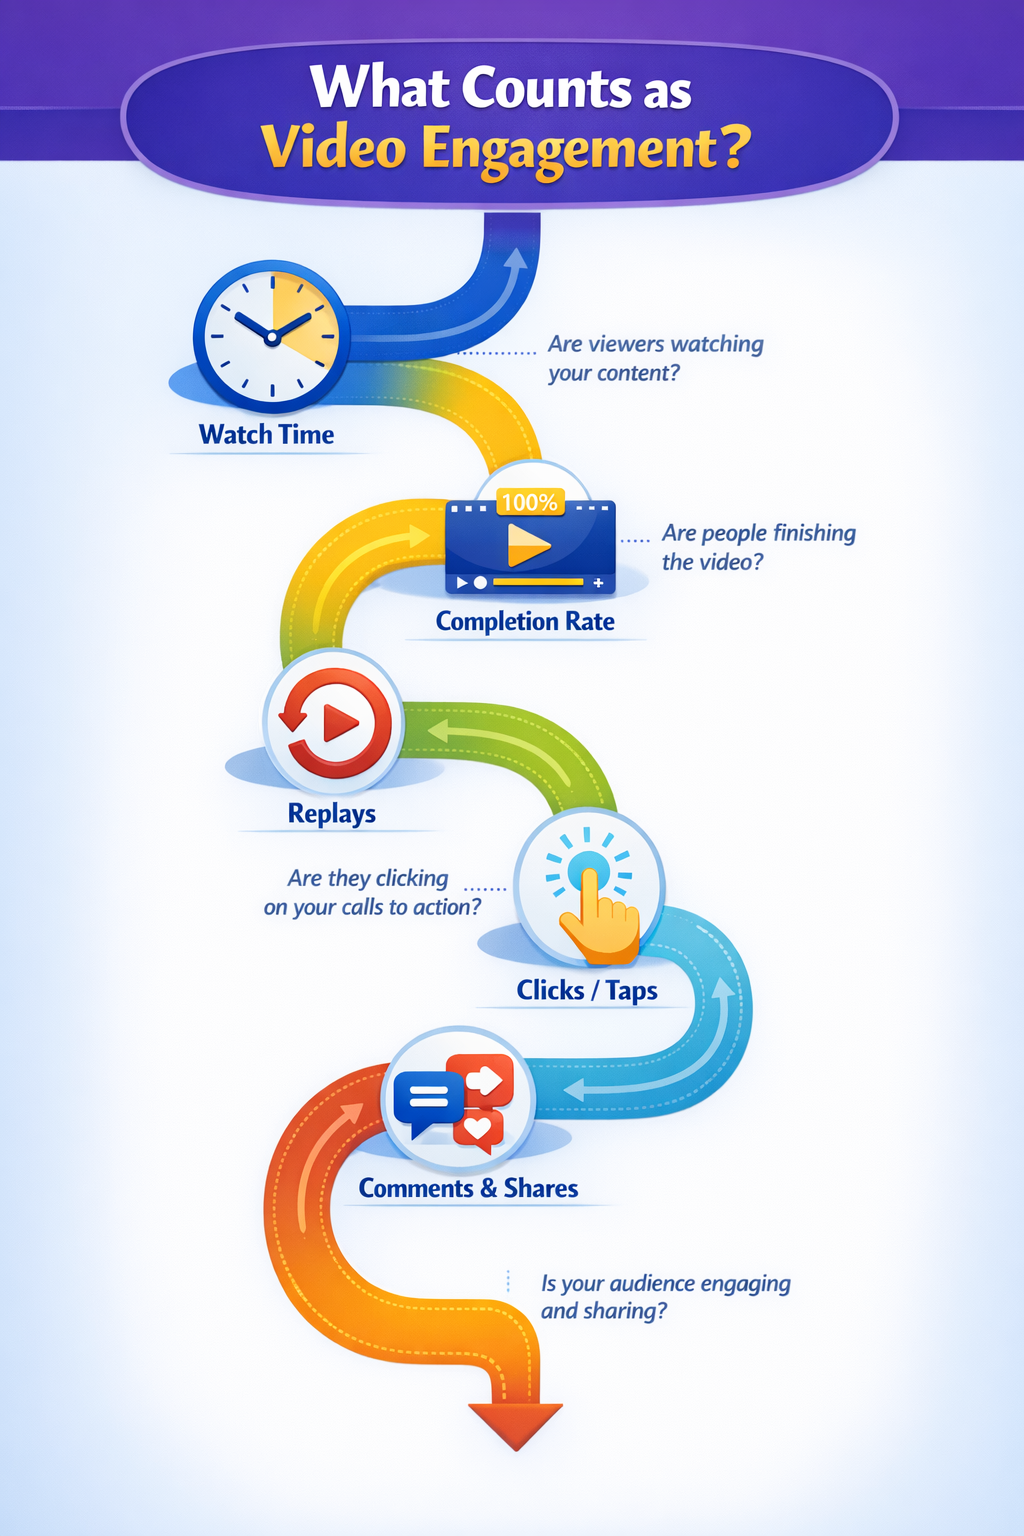
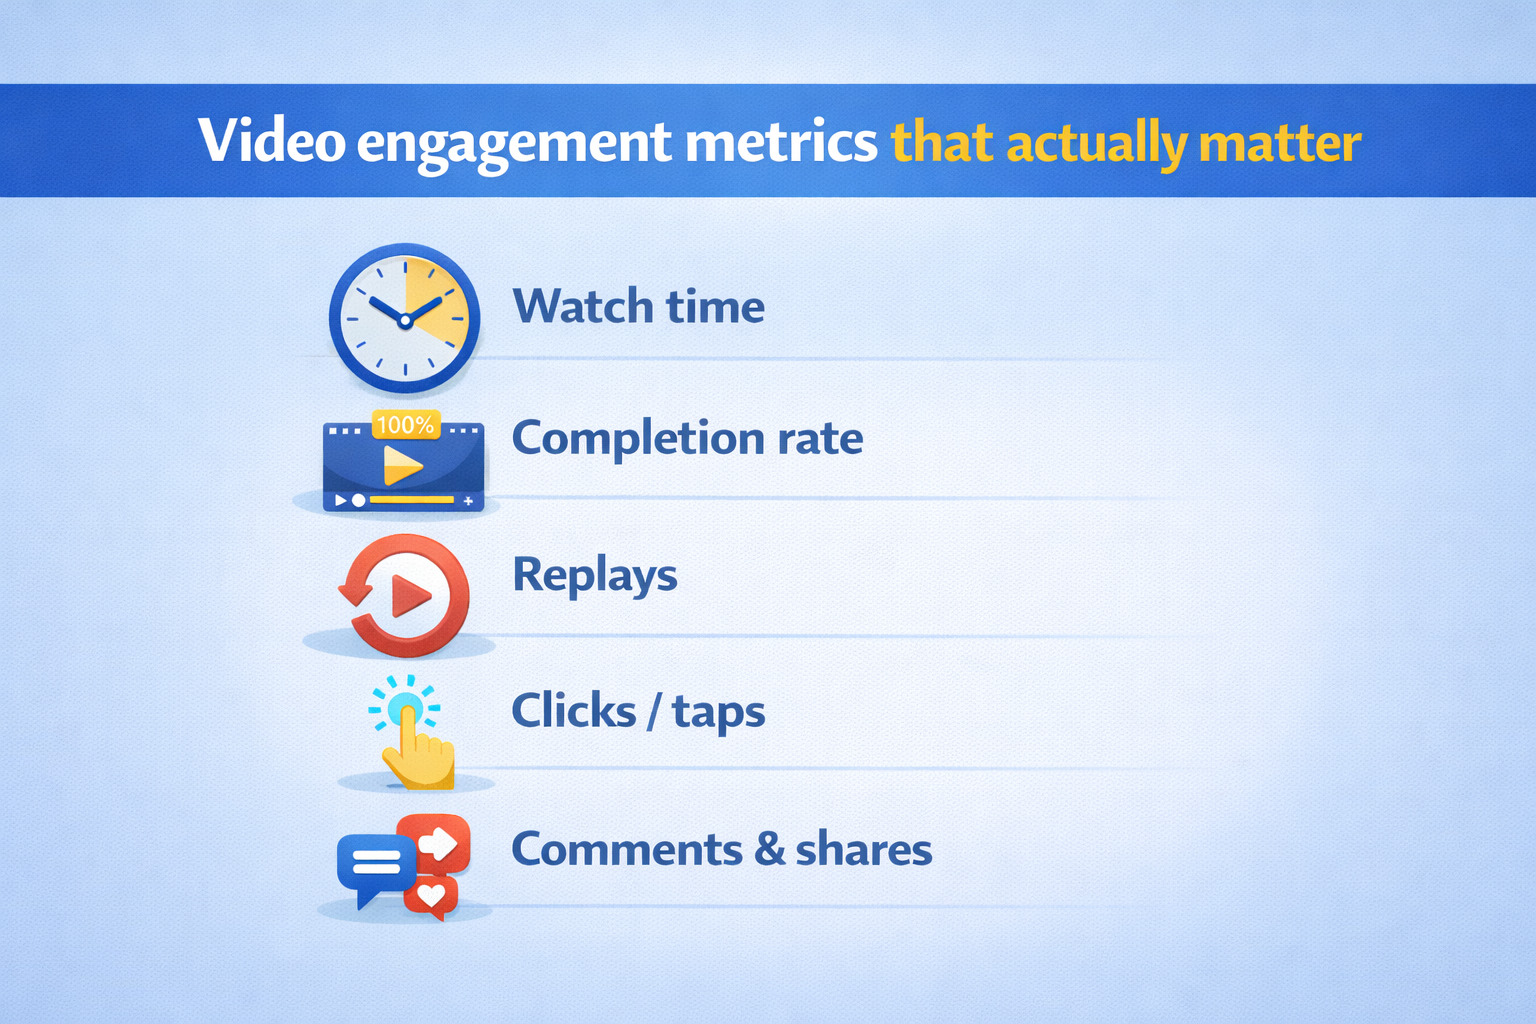
The Video Engagement Metrics That Actually Matter
Not every metric offers meaningful insight into viewer behavior.
When evaluating video performance, the most useful metrics are the ones that reflect attention, interest, and intent, not just exposure.
1. Watch time
Watch time shows how long viewers spend watching your video.
It helps you understand whether people stayed long enough to consume the content rather than scrolling away quickly. Watch time can be viewed as total watch time across all viewers or as average watch time per viewer.
For example, if 1,000 people watch a 60-second video and most viewers leave after 20 seconds, the average watch time will reflect that drop in attention even if the view count looks high.
Creator takeaway: If watch time is low, focus on improving the opening. Shorten intros, clarify the value within the first few seconds, and remove unnecessary buildup.
- On YouTube, total watch time is a key factor used by the algorithm to recommend content watching longer signals relevance and quality.
- On TikTok, average watch time and completion rate are important signals that influence how widely a video is shown in users’ feeds.
On Instagram & Facebook, watch time and completion are considered (but combined with other signals like likes & interactions).
2. Completion rate
Completion rate measures the percentage of viewers who watched the video until the end.
This metric helps identify whether your content holds attention throughout its duration. A high completion rate usually indicates strong structure, clear messaging, and effective pacing.
For instance, if 500 people start watching a video and 250 reach the final frame, the completion rate would be 50 percent.
Creator takeaway: If the completion rate is low, tighten the middle of the video. Remove repetitive sections and ensure each moment adds value.
TikTok: Completion rates above ~50–70% are often a sign the video resonated (short formats tend to see higher completion).
YouTube: A >40–50% completion rate for mid-length videos is a strong performance (varies with topic and length).
Instagram / Facebook: Aim for similar completion trends relative to video length — shorter Reels (~15–30 s) can see >70% completions.
3. Replays
Replays track how often viewers watch a video more than once.
This often happens when content is informative, entertaining, or requires viewers to review a moment again, such as instructions, explanations, or quiz-based content.
If viewers replay a video to recheck details or answers, it signals deeper interest rather than passive viewing.
Creator takeaway: If replays are low, consider adding moments that encourage viewers to pause, think, or review, such as tips, comparisons, or quiz-style prompts.
4. Clicks & Taps
Clicks and taps measure active interaction with the video.
This includes selecting options, tapping interactive elements, or clicking links embedded in the video. Unlike passive metrics, clicks require intentional action from the viewer.
For example, if a quiz video receives 2,000 views but 900 viewers tap an answer, those interactions represent a much stronger engagement signal than views alone.
Creator takeaway: If interactions are low, the issue is usually clarity. Make interaction prompts simpler, more visible, and clearly tied to what the viewer gains.
5. Comments & shares
Commenting shows that viewers had a reaction or opinion, while sharing reflects that the content was valuable enough to pass along to others.
Even when these numbers are smaller, they often represent high-quality engagement because they involve time, thought, and personal intent.
Creator takeaway: If comments and shares are low, try ending videos with a clear question or opinion-based prompt that encourages response.
How Engagement Metrics Change for Quiz & Interactive Videos
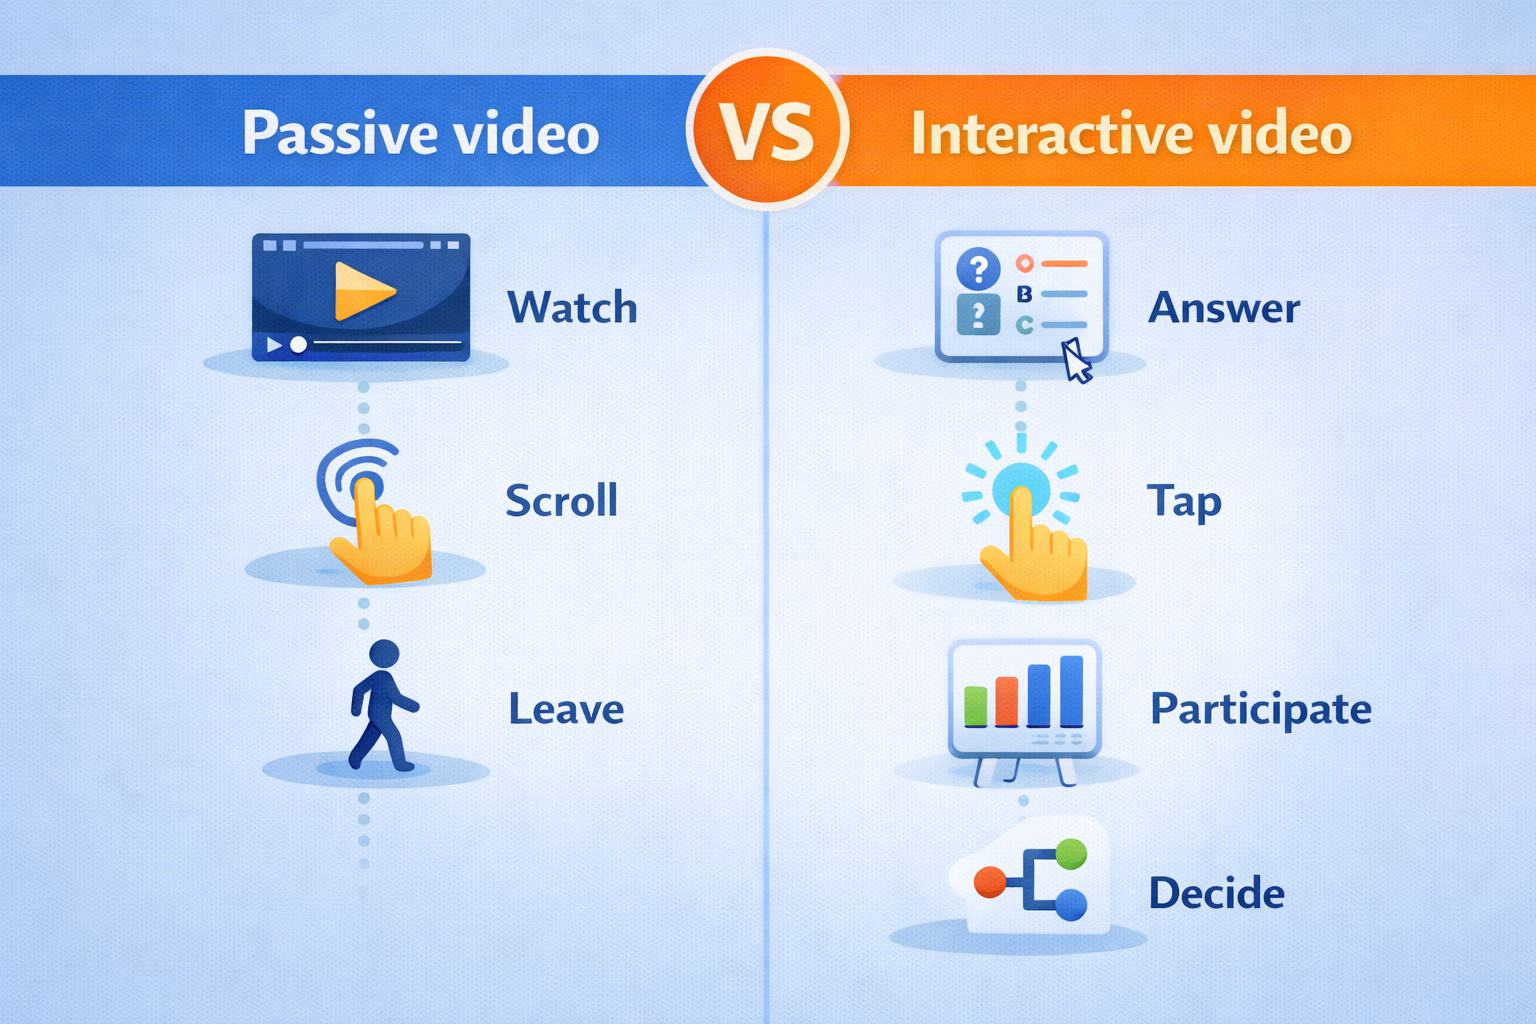
Traditional video engagement metrics focus primarily on viewing behavior. They measure how long someone watched or whether they reached the end. While this works for passive videos, it provides limited insight into how actively viewers were involved.
Quiz and interactive videos change this entirely.
Instead of only tracking watching behavior, these formats introduce participation-based engagement, offering deeper and more precise engagement data.
As a result, quiz video engagement metrics reveal intent, attention, and decision-making behavior that standard video analytics cannot capture.
1. Answer rate
Answer rate measures how many viewers actively respond to quiz questions.
A high answer rate indicates that viewers are not just watching but are mentally engaged and willing to participate. Unlike likes or views, answering a question requires conscious effort.
2. Drop-off per question
Drop-off per question shows where viewers stop interacting.
Instead of only knowing when someone exited the video, teams can see exactly which question or moment caused disengagement.
3. Interaction frequency
Interaction frequency tracks how often viewers take action during the video.
This includes answering questions, clicking options, or tapping interactive elements.
4. Completion versus participation
In traditional videos, completion rate is often treated as the main success metric.
In quiz and interactive videos, completion alone is not enough.
A viewer may complete the video but skip interactions, while another may actively participate even if they exit early. Participation provides a clearer signal of engagement quality than completion alone.
Why quiz videos provide deeper engagement data
Quiz and interactive videos transform engagement from passive consumption into measurable participation.
Instead of guessing whether viewers were paying attention, marketers can see direct behavioral signals through responses, interactions, and decision points.
This results in more meaningful video performance metrics and clearer insights compared to traditional video analytics, where attention is often inferred rather than observed.
How to Track Video Engagement Metrics Across Platforms
Video engagement metrics vary across platforms, but the goal remains the same: understanding how viewers behave, not just how many people you reach.
Instead of comparing numbers directly, teams should focus on interpreting engagement signals within each platform’s context.
On Instagram, videos are designed for fast, scroll-based consumption, particularly within feeds and Reels.
According to Instagram’s creator guidance, early engagement signals such as watch time, completion rate, and interactions (including likes, comments, taps, and replies) play an important role in determining how content is distributed.
Because many videos auto-play as users scroll, reach metrics can inflate quickly. Engagement metrics provide clearer insight into whether viewers intentionally stayed with the content or actively interacted with it, which Instagram identifies as a sign of relevance and viewer interest.
(Source: Meta for Creators )
YouTube
YouTube is built around longer viewing sessions and intentional discovery through search, recommendations, and subscriptions.
YouTube has consistently stated that watch time and audience retention are among the most important signals used to evaluate video performance and viewer satisfaction.
In addition to viewing duration, YouTube highlights engagement actions such as comments, likes, and replays as indicators of deeper interest and returning viewers. Rather than focusing solely on total views, YouTube recommends analyzing engagement patterns over time to understand how videos contribute to overall session watch time and long-term channel growth.
(Source: YouTube Creator Academy)
TikTok
TikTok is driven by discovery and rapid testing.
Videos may reach large audiences quickly, but performance depends heavily on early engagement signals. Completion rate, replays, and interaction frequency play a significant role in determining continued distribution.
Because reach can fluctuate widely, engagement trends matter more than single-post results.
(Source: Hootsuite)
Tracking engagement the right way
Across all platforms, the key is not to compare numbers directly.
Each platform measures engagement differently, so meaningful video analytics come from tracking patterns over time within the same platform, rather than benchmarking Instagram against YouTube or TikTok.
How to Use Engagement Metrics to Improve Future Videos
Engagement metrics are most valuable when they lead to action. Instead of treating video analytics as reporting numbers, teams should use them to refine content decisions and improve future performance.
What to tweak:
- When engagement drops early in the video, it often points to issues in the opening.
- Low watch time or early drop-offs may indicate that the hook is unclear, the pacing is slow, or the message takes too long to reach the point.
- In these cases, small adjustments such as shortening the introduction, clarifying the value earlier, or tightening visuals can significantly improve attention.
- Engagement metrics help identify where viewers lose interest, making optimization more targeted.
What to double down on:
- When a video shows high completion rates, repeated interactions, or frequent replays, it usually means the content is connecting with your audience.
- These signals help you identify what is working, whether it is the topic, the format, the tone, or the way the story is told.
- Using engagement data this way allows teams to build on proven formats rather than guessing future content ideas.
What to stop doing:
- When videos consistently show poor watch time, very few interactions, or declining participation, it often means the content is not matching what the audience wants.
- Instead of repeating the same approach, these signals help teams identify what is not working and shift focus toward formats and ideas that perform better.
- Knowing when to stop underperforming patterns is just as important as building on successful ones.
Turning data into direction:
When used correctly, engagement metrics provide guidance, not just measurement.
They help teams understand viewer behavior, refine creative decisions, and continuously improve video performance based on real audience signals rather than assumptions.
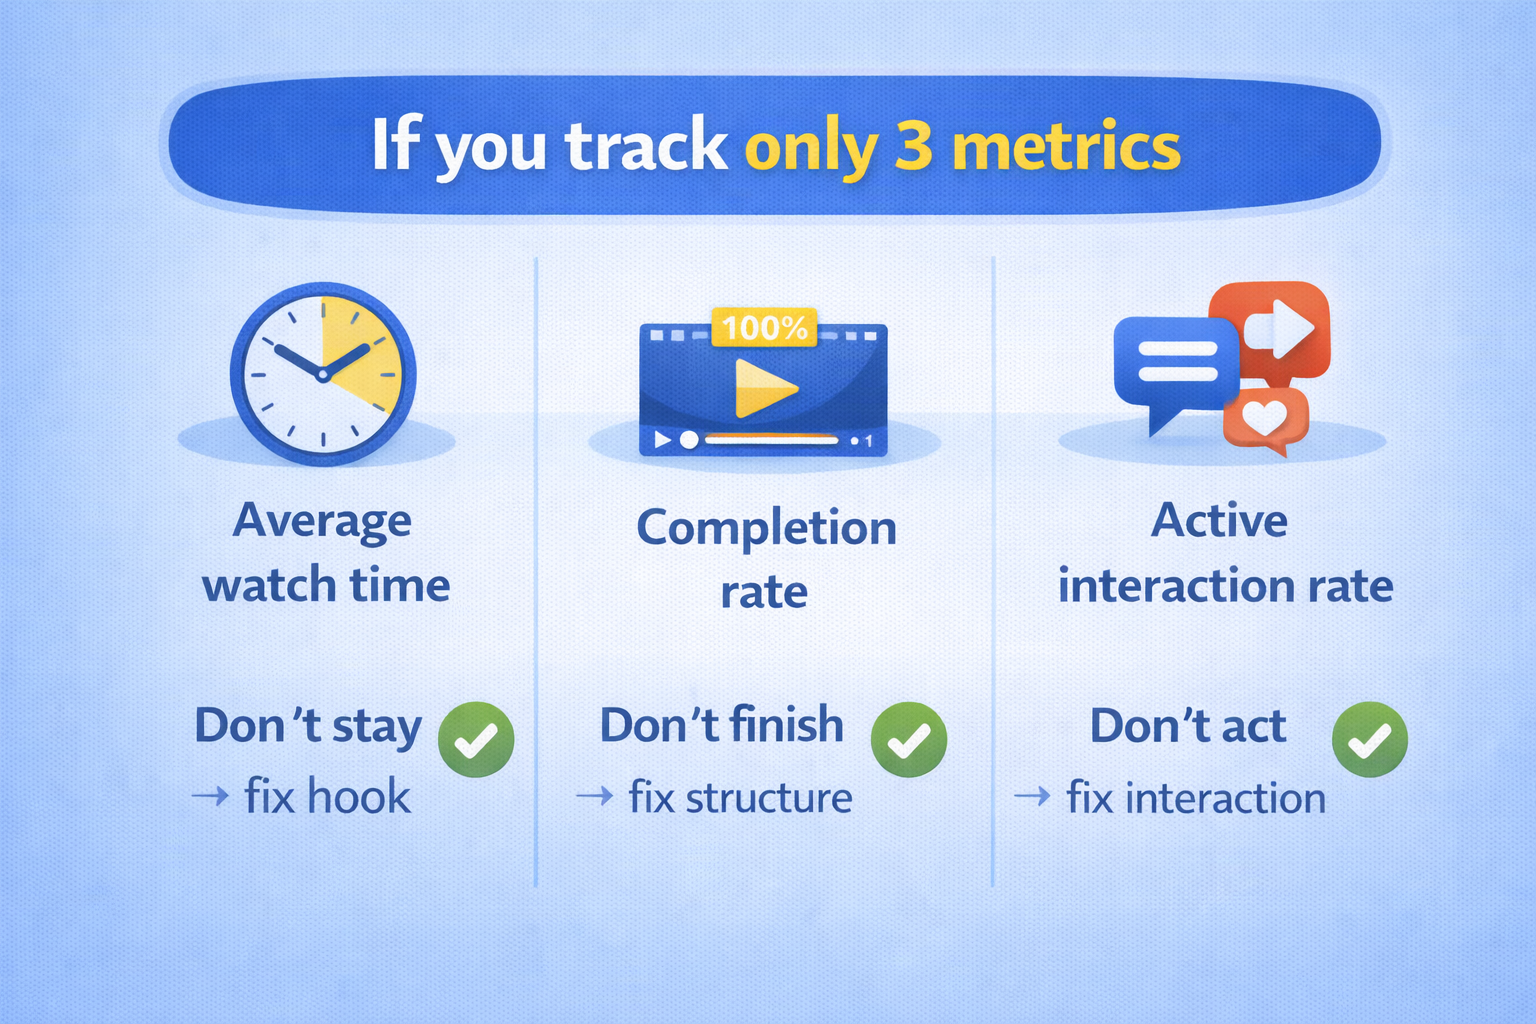
But tracking everything creates noise.
If I only track 3 things this week, what should they be?
- Average Watch Time
- Completion Rate
- Active Interaction Rate
TL;DR - The Video Metrics That Matter Most
- Watch time is the strongest signal of content quality.
- Completion rate shows whether viewers stay until the end.
- Engagement rate reveals real audience resonance.
- CTR measures call-to-action effectiveness.
- Views matter for reach, but not engagement.
FAQs About Video Engagement Metrics
What are video engagement metrics?
Video engagement metrics measure how viewers interact with a video after seeing it. They include actions like watch time, completion rate, clicks, comments, and shares. These metrics help creators understand whether people actually paid attention to the content instead of simply scrolling past it.
Why are video engagement metrics more important than views?
Views only show that a video appeared on someone’s screen. Engagement metrics reveal what happened next. They show whether viewers stayed, watched longer, interacted, or responded, which provides a clearer picture of content quality and audience interest.
What is a good video watch time?
A good video watch time usually means viewers watch around 40 to 60 percent of the video. Higher watch time suggests the content is relevant and holds attention. However, what counts as “good” can vary depending on video length and platform.
How does engagement affect video rankings?
Most platforms use engagement signals to decide which videos to promote. Strong watch time, interactions, and shares indicate that viewers find the content valuable, increasing the likelihood that the video will be recommended to a wider audience.